Overview
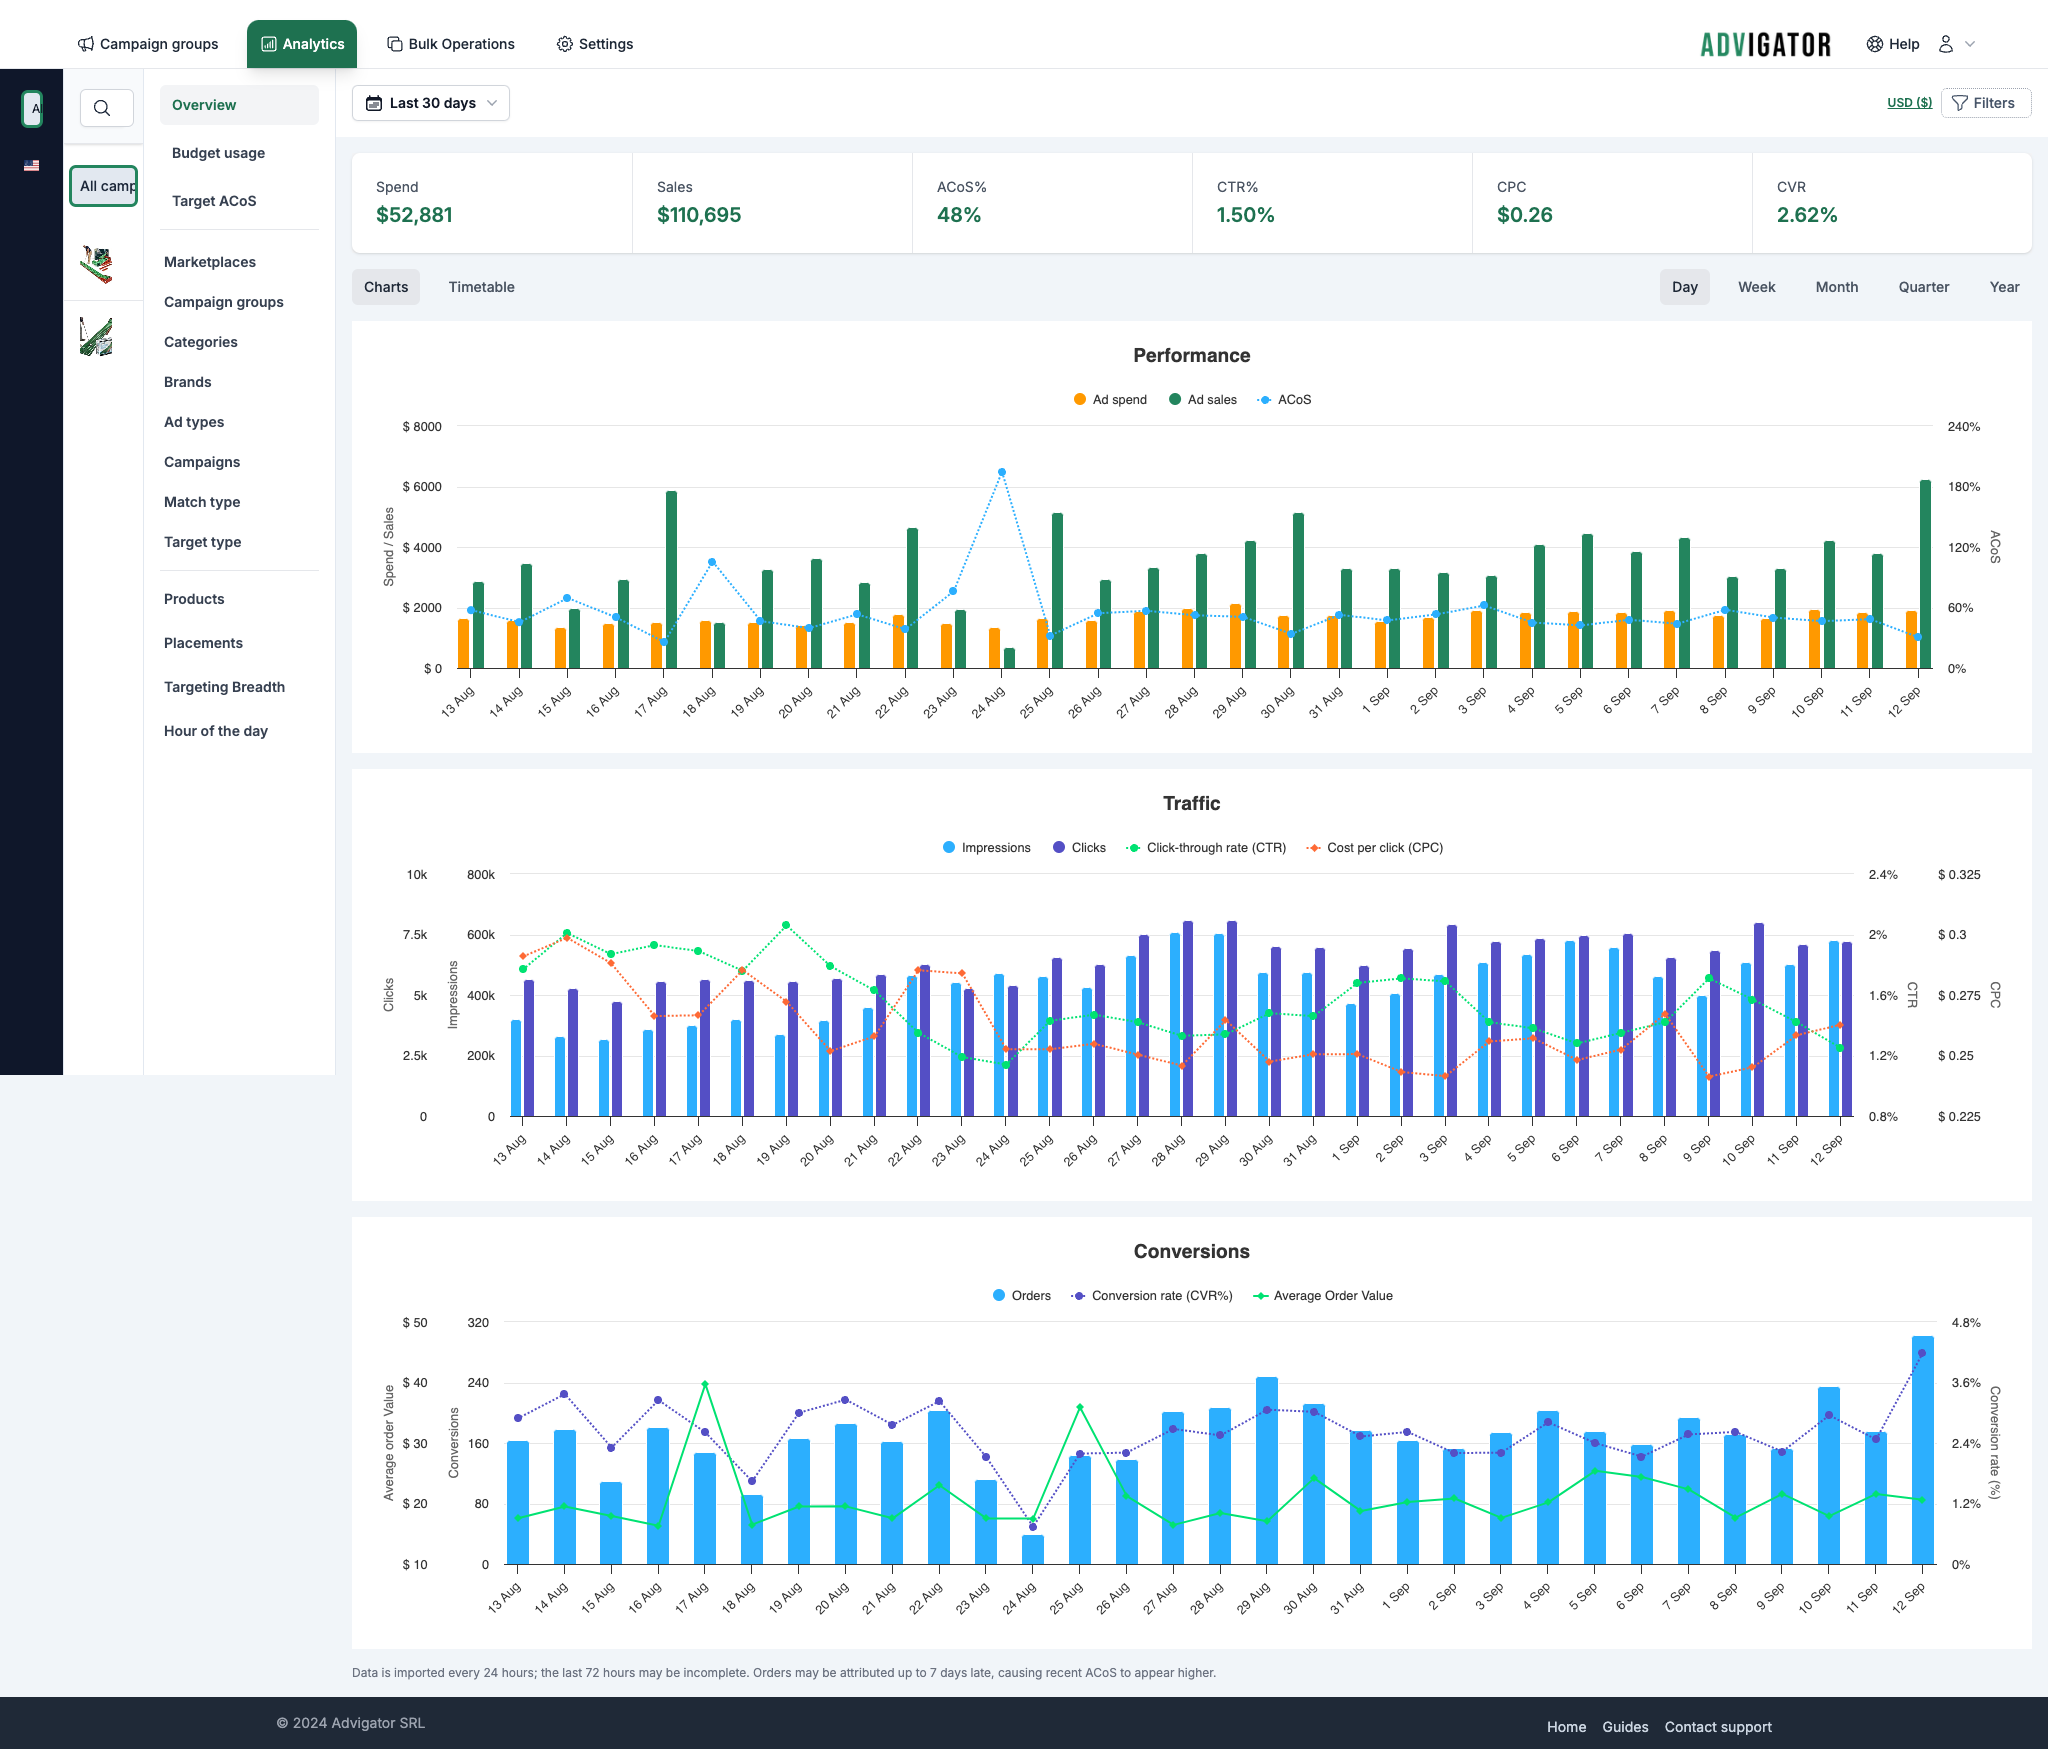
From the Analytics section, you can get a complete view of how your campaigns are performing.
You can view this data across multiple marketplaces in a single currency, for the entire country, or for individual products.
With the sidebar you will navigate very easily between products and marketplaces.
Aggregate by Marketplace, Category, Brand, or Product
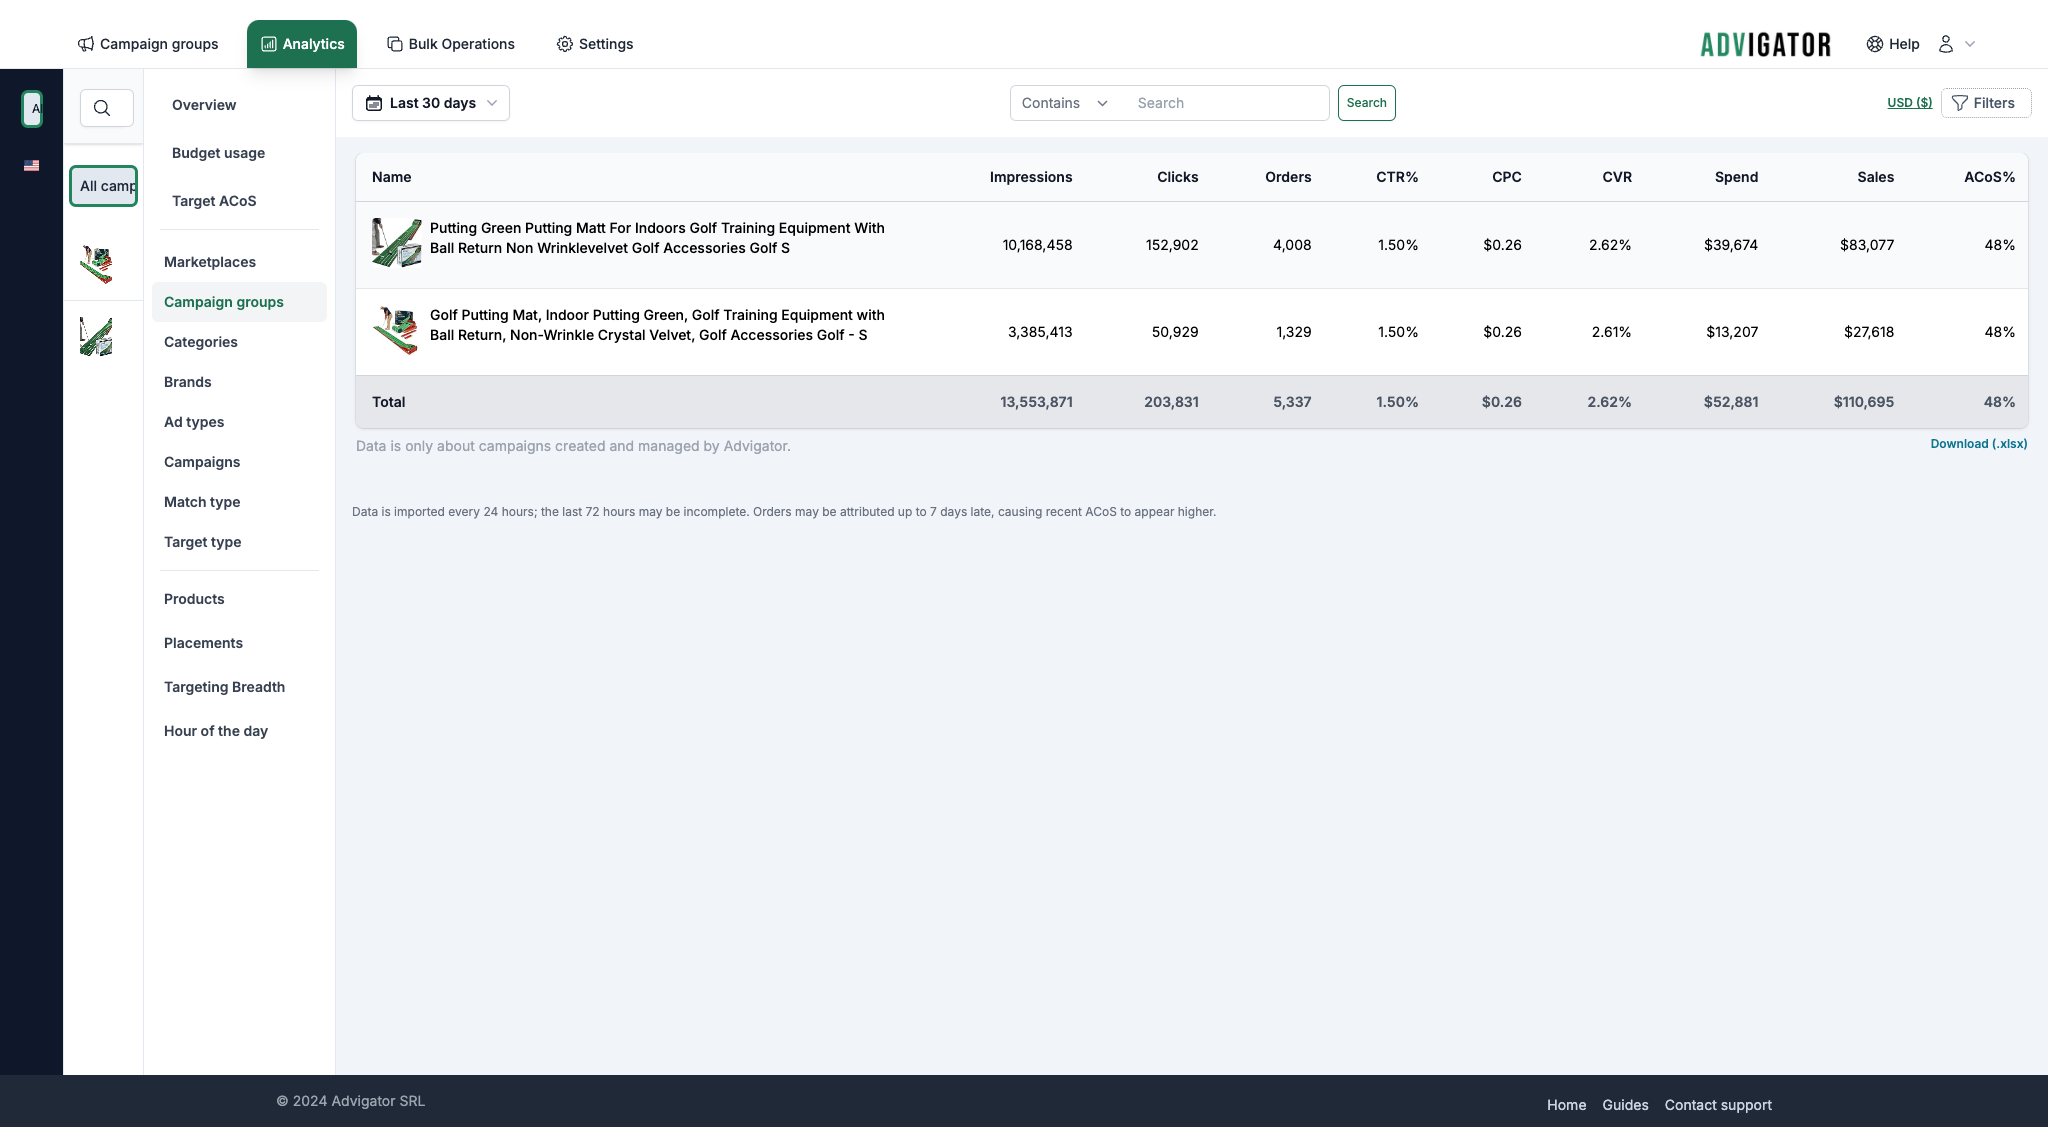
You can view the data at different levels of granularity. Here’s an example of data grouped by campaign group. Everything you see can be exported to Excel.
Budget usage
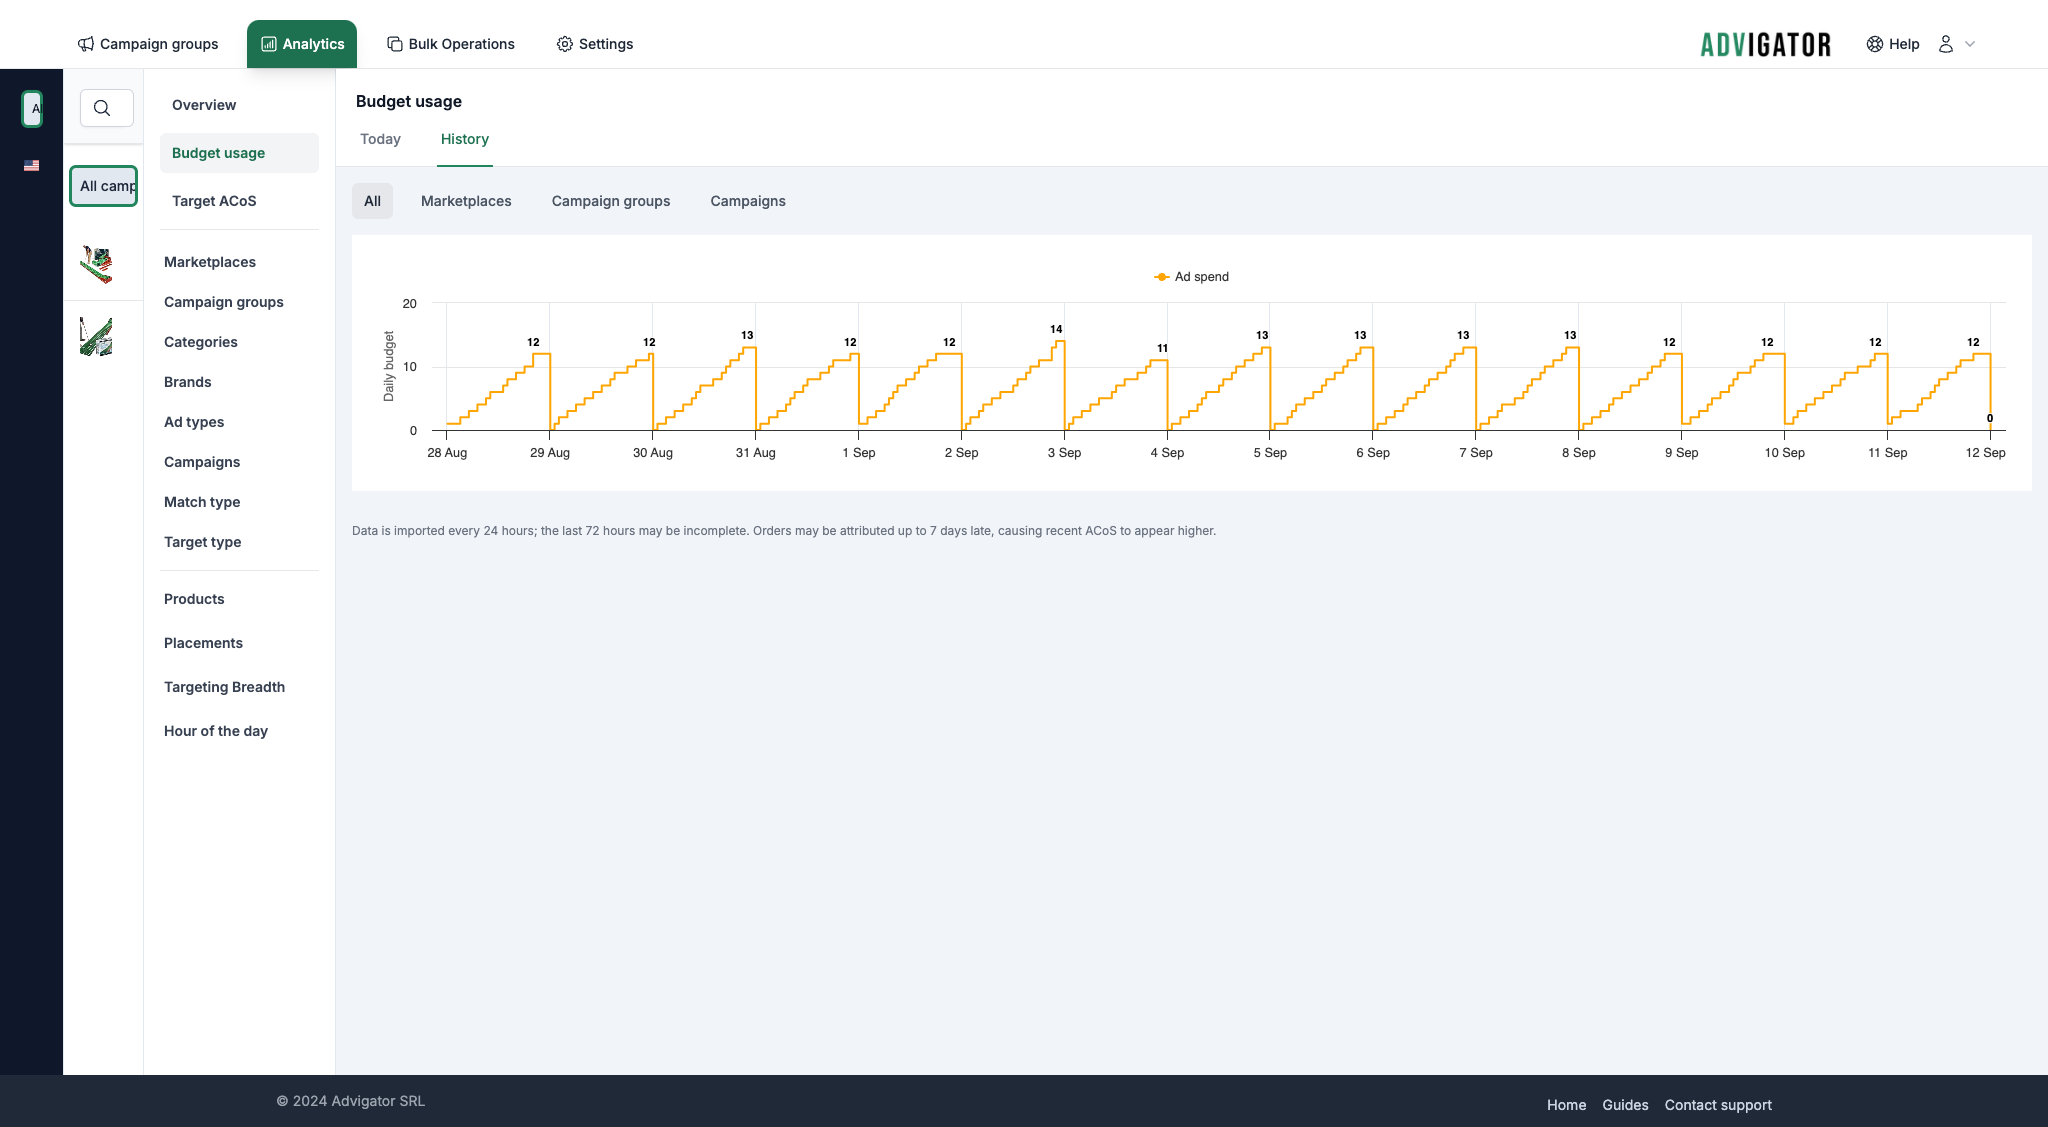
In Analytics > Budget Usage, you can monitor your budget consumption in real time and see at what time of day it usually runs out.
Hourly data
In Analytics > Hour of the day, you can track spend, sales, and orders for each hour of the day.


